Python和科学计算认证群组 - 讨论区
标题:mayavi MlabSceneModel scene 怎么添加 actor 的 pipeline

2012年10月25日 星期四 10:37
# -*- coding: utf-8 -*-
from enthought.traits.api import HasTraits, Button, Instance
from enthought.traits.ui.api import View, Item, HSplit, VGroup
from enthought.tvtk.pyface.scene_editor import SceneEditor
from enthought.mayavi.tools.mlab_scene_model import MlabSceneModel
from enthought.mayavi.core.ui.mayavi_scene import MayaviScene
from enthought.tvtk.api import tvtk
class FieldViewer(HasTraits):
plotbutton = Button("plot")
scene = Instance(MlabSceneModel, ()) # mayavi场景
view = View(
HSplit(
VGroup(
Item('plotbutton', show_label=False),
Item('scene',
editor=SceneEditor(scene_class=MayaviScene), # 设置mayavi的编辑器
resizable=True,height=300,show_label=True)
),
),
width = 1024, height=768, resizable=True,
)
def __init__(self):
cs = tvtk.ConeSource(height=30.0, radius=10.0, resolution=36)
m = tvtk.PolyDataMapper(input = cs.output)
a = tvtk.Actor(mapper=m)
self.scene.add_actor(a)
app = FieldViewer()
app.configure_traits()
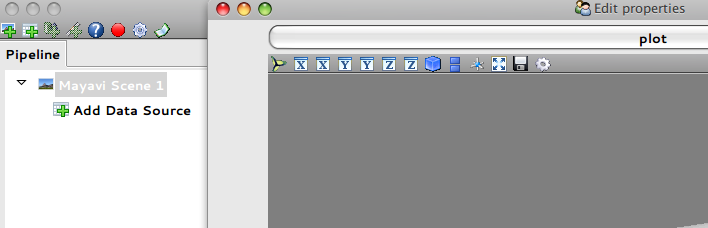
能不能自动生成或者添加这个actor的pipeline呢
我想给这个actor再添加一个切片工具 scalar_cut_plane 但是流水线没有这个actor

2012年10月25日 星期四 12:00
你在Mayavi的scene中创建了一个TVTK的流水线,当然在mayavi的流水线中看不到东西了。
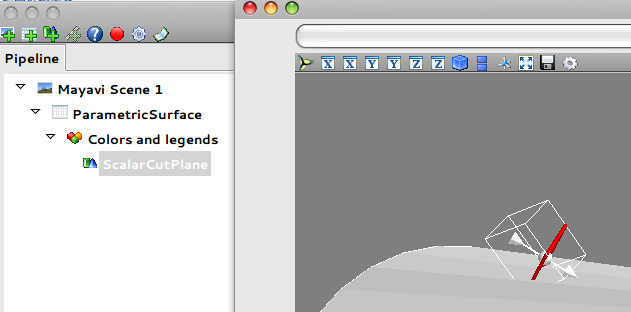
应该用Mayavi的命令创建流水线,下面是程序:
# -*- coding: utf-8 -*-
from enthought.traits.api import HasTraits, Button, Instance
from enthought.traits.ui.api import View, Item, HSplit, VGroup
from enthought.tvtk.pyface.scene_editor import SceneEditor
from enthought.mayavi.tools.mlab_scene_model import MlabSceneModel
from enthought.mayavi.core.ui.mayavi_scene import MayaviScene

class FieldViewer(HasTraits):

    plotbutton = Button("plot")
    scene = Instance(MlabSceneModel, ()) # mayavi场景
    view = View(
        HSplit(
            VGroup(
                Item('plotbutton', show_label=False),
                Item('scene',
                    editor=SceneEditor(scene_class=MayaviScene), # 设置mayavi的编辑器
                    resizable=True,height=300,show_label=True)
            ),
        ),
        width = 1024, height=768, resizable=True,
    )

    def __init__(self):
        engine = self.scene.engine
        from mayavi.sources.builtin_surface import BuiltinSurface
        builtin_surface = BuiltinSurface(source="cone")
        builtin_surface.data_source.resolution = 100
        engine.add_source(builtin_surface, self.scene)

        from mayavi.modules.surface import Surface
        surface = Surface()
        engine.add_filter(surface, builtin_surface)

        from mayavi.modules.scalar_cut_plane import ScalarCutPlane
        scalar_cut_plane = ScalarCutPlane()
        engine.add_filter(scalar_cut_plane, builtin_surface)

app = FieldViewer()
app.configure_traits()
2012年10月25日 星期四 14:16
有mayavi的流水线,方便手动进行操作并且记录下来生成代码

source = Enum('arrow', 'cone', 'cube', 'cylinder', 'disk', 'earth', 'line', 'outline', 'plane', 'point', 'polygon', 'sphere', 'superquadric', 'textured sphere', 'glyph2d')

上边的 tvtk.ConeSource是个例子,我想画个不规则图形

过程是通过立体函数来生成数据,然后通过tvtk.ImageData, tvtk.ContourFilter,tvtk.PolyDataMapper
最终生成一个actor

    contours = tvtk.ContourFilter(input = data)
    contours.number_of_contours = 1
    contours.set_value(0, 0)
    contours.update()
    mapper = tvtk.PolyDataMapper(input = contours.output)
    p = tvtk.Property(opacity=0.3, color=(0, 0.3, 0.3))
    actor = tvtk.Actor(mapper = mapper, property=p)

这种actor怎么通过BuiltinSurface画出来才能在mayavi的流水线中看到呢

或者怎么把图形的数据mapper 或者 data 或者contours.output让mayavi画出来呢
2012年10月25日 星期四 14:26
比如之前这个画圆柱的例子
# -*- coding: utf-8 -*-
from enthought.traits.api import HasTraits, Button, Instance
from enthought.traits.ui.api import View, Item, HSplit, VGroup
from enthought.tvtk.pyface.scene_editor import SceneEditor
from enthought.mayavi.tools.mlab_scene_model import MlabSceneModel
from enthought.mayavi.core.ui.mayavi_scene import MayaviScene
from enthought.tvtk.api import tvtk
import numpy as np
def transform(x, y, z, rx, ry, rz, sx, sy, sz, tx, ty, tz):
from numpy import sin, cos, dot
rx, ry, rz = np.deg2rad([rx, ry, rz])
fx, fy, fz = x.flatten(), y.flatten(), z.flatten()
ones = np.ones(len(fx))
p = np.r_[[fx], [fy], [fz], [ones]]
mx = np.array([
[1, 0, 0, 0],
[0, cos(rx), sin(rx), 0],
[0, -sin(rx), cos(rx), 0],
[0, 0, 0, 1]
])
my = np.array([
[cos(ry), 0, -sin(ry), 0],
[0, 1, 0, 0],
[sin(ry), 0, cos(ry), 0],
[0, 0, 0, 1]
])
mz = np.array([
[cos(rz), sin(rz), 0, 0],
[-sin(rz), cos(rz), 0, 0],
[0, 0, 1, 0],
[0, 0, 0, 1]
])
s = np.array([
[1.0/sx, 0, 0, 0],
[0, 1.0/sy, 0, 0],
[0, 0, 1.0/sz, 0],
[0, 0, 0, 1]
])
t = np.array([
[1, 0, 0, 0],
[0, 1, 0, 0],
[0, 0, 1, 0],
[-tx, -ty, -tz, 1]
])
m = dot(t, dot(s, dot(mz, dot(my, mx))))
p = np.dot(m, p)
x = p[0,:].reshape(x.shape)
y = p[1,:].reshape(y.shape)
z = p[2,:].reshape(z.shape)
return x, y, z
def f1(x, y, z):
x,y,z = transform(x,y,z, 0, 0, 0, 1, 1, 1, 0, 0, 0)
return x**2 + z**2 + 0*y - 60.0 *60.0
def make_image(f,x0,x1,y0,y1,z0,z1,N):
global z, y, x
z, y, x = np.mgrid[z0:z1:1j*N,y0:y1:1j*N, x0:x1:1j*N]
d = f(x, y, z)
dx, dy, dz = float(x1-x0)/(N-1), float(y1-y0)/(N-1), float(z1-z0)/(N-1)
img = tvtk.ImageData(dimensions=(N,N,N), origin=(x0,y0,z0), spacing=(dx,dy,dz))
img.point_data.scalars = d.flatten()
return img
def make_surface(*args):
img = make_image(*args)
contours = tvtk.ContourFilter(input = img)
contours.number_of_contours = 1
contours.set_value(0, 0)
contours.update()
mapper = tvtk.PolyDataMapper(input = contours.output)
p = tvtk.Property(opacity=0.3, color=(1, 0.5, 0.3))
actor = tvtk.Actor(mapper = mapper, property=p)
return contours.output, actor
class FieldViewer(HasTraits):
plotbutton = Button("plot")
scene = Instance(MlabSceneModel, ()) # mayavi场景
view = View(
HSplit(
VGroup(
Item('plotbutton', show_label=False),
Item('scene',
editor=SceneEditor(scene_class=MayaviScene), # 设置mayavi的编辑器
resizable=True,height=300,show_label=True)
),
),
width = 1024, height=768, resizable=True,
)
def __init__(self):
parameters = [-100,100,-100,100,-100,100,50]
poly, a = make_surface(f1, *parameters)
self.scene.add_actor(a)
app = FieldViewer()
app.configure_traits()
2012年10月25日 星期四 15:38
没有搞懂你要问什么。是如何在Mayavi中生成等值面吗?
2012年10月25日 星期四 16:23
想画一个f1()函数确定的一个图形
用tvtk可以按照
tvtk.ImageData, tvtk.ContourFilter,tvtk.PolyDataMappe 顺序生成一个actor,加入scene中,

但是SceneEditor中不显示流水线,我就不能再对这个actor通过流水线进行交互的操作

1. 想还是这样生成actor,但能不能让SceneEditor里显示流水线,

   这样通过流水线鼠标操作我想再加个切面或者其他的操作

2. 要是1行不通,必须用mayavi画才能在SceneEditor中有流水线,

   那mayavi怎么样画f1()函数确定的这个图形呢
2012年10月25日 星期四 21:23
mayavi的等值面在书里面有介绍: mlab.contour3d


Zeuux © 2026
京ICP备05028076号