Python和科学计算认证群组 - 讨论区
标题:关于mat


2012年11月12日 星期一 20:39
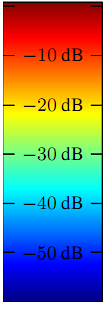
可以将ticklabels隐藏起来,自己在colorbar上绘制text,下面是一个例子:
# -*- coding: utf-8 -*-
import pylab as pl
ax = pl.subplot(111)
pl.imshow(pl.random((100,100)))
c = pl.colorbar(aspect=6)
cax = c.ax

cax.tick_params(which='both', width=2)

for t, y in zip(cax.yaxis.get_ticklabels(), cax.yaxis.get_ticklocs()):
    cax.text(0.5, y, t.get_text()+"dB", transform=cax.transAxes, ha="center", va="center")

cax.yaxis.set_ticks_position('both')
cax.yaxis.set_ticklabels([])

pl.show()


Zeuux © 2026
京ICP备05028076号