Python和科学计算认证群组 - 讨论区
标题:请教如何画出这样的图形


2013年03月30日 星期六 17:15
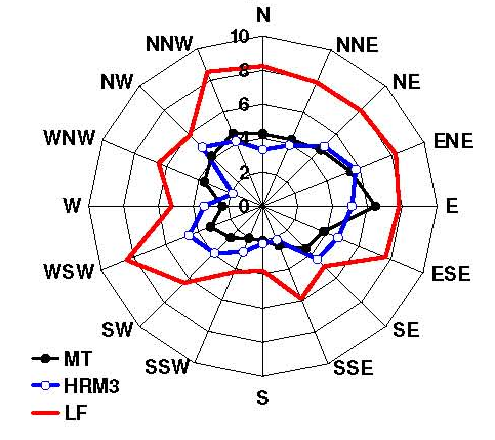
这个应该用极坐标绘图吧。
http://matplotlib.org/examples/pylab_examples/polar_legend.html
2013年04月04日 星期四 06:08
用'o-'样式,或者分别画线和点,例如:
http://matplotlib.org/examples/api/date_index_formatter.html
http://matplotlib.org/examples/mplot3d/mixed_subplots_demo.html
2013年04月04日 星期四 16:13
十分感谢版主!


Zeuux © 2026
京ICP备05028076号